Abstract
Wildfire seasons have grown longer, more frequent and more intense in recent decades, demanding better tools for public awareness and decision support. Commonly used GIS dashboards and scientific simulators provide rich data but commonly lack the narrative clarity demanded to engage non-technical audiences. This thesis presents a purely visual, time-lapse wildfire visualization pipeline built in Unity3D. The modular framework ingests Cesium elevation models and NASA FIRMS active fire detections, converting them into georeferenced terrain, draped imagery and particle-based fire emitters. Detections are clustered within a user-configured spatial radius, marker size is scaled by fire radiative power to convey relative intensity, and all layers are sequenced on a day-by-day timeline the viewer can scrub interactively.
The application is delivered as a desktop reference build and as a browser deployment of the same pipeline requiring no installation. The browser deployment was evaluated against kepler.gl and an ArcGIS Online Experience Builder application in a counterbalanced study with 68 participants. It produced the highest mean comprehension score of the three tools and was rated as favorably as the commercial platform on the visualization qualities assessed, while being found significantly less usable — a gap concentrated among participants without prior 3D or GIS experience. The strongest result concerns terrain: participants using the tool without a rendered elevation surface described a mountainous landscape correctly in just 9.5 percent of cases, against near-complete accuracy for both terrain-based tools. The pipeline requires no paid license and no proprietary GIS platform. Full figures on the Results page.
Thesis Details
Key Features
- Python acquisition pipeline — Queries the MODIS FIRMS product day-by-day over the study period and exports fire records as CSV and point shapefile (EPSG:4326); a companion routine samples Open-Meteo on a 1° grid for daily temperature, wind, and cloud cover.
- Cesium coordinate bridge — WGS84 coordinates are converted to ECEF and then to Unity world space, with
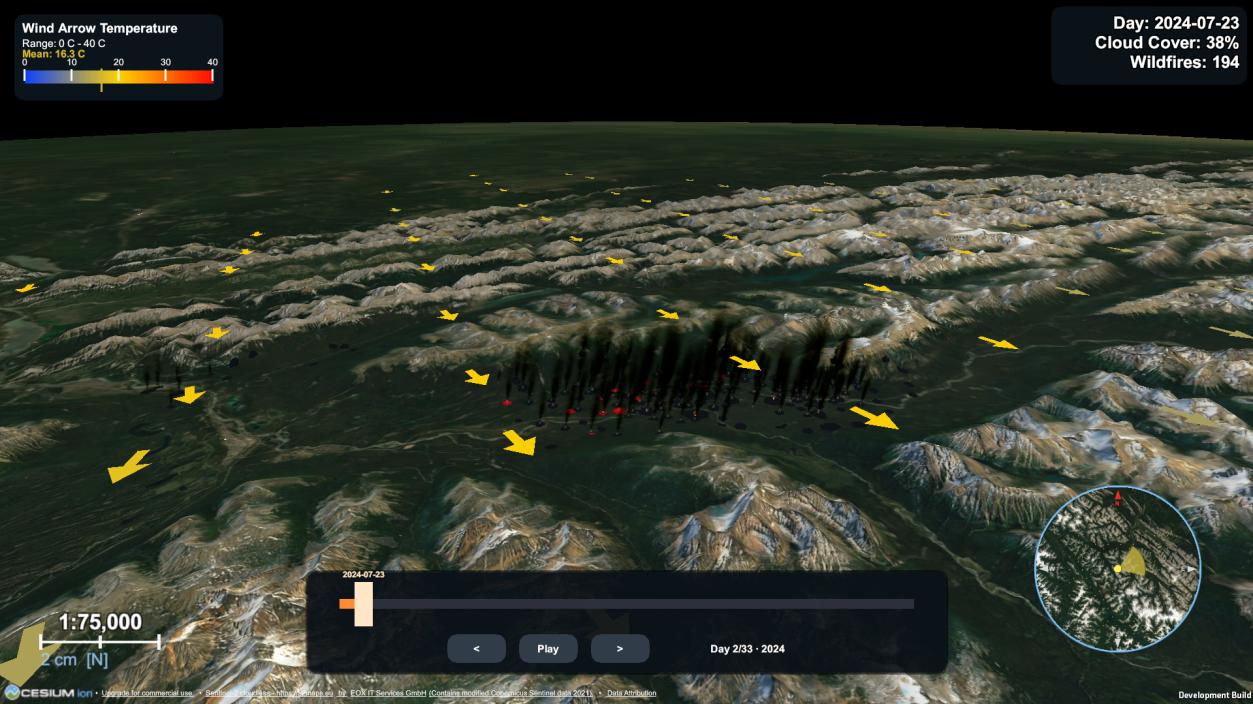
CesiumGlobeAnchororigin-shifting keeping fire markers geographically accurate as the camera moves. - Day-by-day timeline animation — Fires are grouped by detection date and cross-faded chronologically; marker size scales with detection density and Fire Radiative Power to communicate intensity.
- Wind and cloud-cover overlays — A directional wind-arrow grid (coloured by temperature) and a cloud-cover readout, both driven by the Open-Meteo dataset, update as the timeline advances.
- Dual camera modes — Free-fly WASD/mouse navigation on desktop, and a map-style drag-to-look controller with a "Go to Fire" button in the WebGL build.
- MODIS confidence filtering — Detections are filtered to nominal confidence and above (≥ 30%), the minimum established in the fire-extent literature (Giglio et al., 2016).
- WebGL deployment — Beyond the desktop build, the pipeline is compiled to Unity's WebGL target so the Jasper reconstruction can be explored in-browser through a single link.
- Comparative user study — Comprehension, adapted usability (SUS-based), and engagement/rating items were benchmarked in a counterbalanced study with 68 participants against kepler.gl and an ArcGIS Online Experience Builder, each presenting a different real wildfire event.
Study Area
The platform is validated against the 2024 Jasper wildfire, a fire complex that burned in Jasper National Park, Alberta, Canada, in July 2024. Its short, extremely intense detection sequence — concentrated in a compact, high-elevation urban-wildland interface — tests the platform's ability to convey dramatic temporal acceleration against a relatively sparse overall dataset.
| Bounding Box | Area | Final Fire Size | Evacuated | Structures Destroyed | Insured Losses |
|---|---|---|---|---|---|
| 119.0°W, 52.5°N – 117.0°W, 53.5°N | ~11,000 km² (park core) | 32,722 ha | 25,000 | 358 of 1,113 | $880 million CAD |
Ignited by lightning south of the townsite, the fire reached Jasper in under 48 hours, with flame heights of 30–50 m and spot fires starting up to 500 m ahead of the front from lofted embers.
System Workflow Overview
- Data acquisition — A Python script queries MODIS fire detections one day at a time over the Jasper bounding box, retrying failed requests with exponential backoff, and exports the concatenated dataset as CSV and point shapefile (EPSG:4326). Open-Meteo is sampled on a 1° grid for daily temperature, wind, and cloud cover.
- Data loading — At runtime, Unity reads the shapefile through NetTopologySuite, retaining detections of nominal confidence and above (≥ 30%).
- Coordinate transformation — Each fire’s WGS84 latitude/longitude is converted to ECEF and then to Unity world space via the
CesiumGeoreference, with a terrain-readiness gate delaying spawn until Cesium tiles are loaded. - Clustering & marker spawn — Nearby, temporally close detections are grouped; each marker's scale reflects its Fire Radiative Power and cluster size.
- Timeline construction — Fire records are grouped by date; day-by-day playback cross-fades markers in and out via Unity's Timeline.
- Interactive exploration — The user navigates the 3D scene (free-fly on desktop, map-style drag-look in the browser), watches wind and cloud overlays update per day, and can jump to the fire's centre on demand.
- WebGL deployment — The same build is additionally compiled to WebGL and hosted with cross-origin-isolation headers, so the reconstruction can be shared through a single browser link.